The Stoxcraft Formula in 60 seconds
The Stoxcraft Formula is the scoring system behind every card on the platform: three Core Scores, Health, Performance and Risk, that combine into a single Overall Rating you can read in seconds instead of an afternoon.
Instead of digging through balance sheets yourself, line by line, the Formula does the digging and hands you the result as a clean stat block. Health Score tells you how solid the underlying business actually is, not just how the stock happens to be trading this week. Performance Score tells you how the stock has actually done, benchmarked against the broader market and its own sector rather than in isolation. Risk Score tells you how bumpy the ride has been and could still be, so you're not surprised later by something the data already knew.
Stack all three together and you get the Overall Rating, shown as stars, not another number to decode on top of the three you already have.
None of it is a black box for the sake of mystery or to make the platform feel more sophisticated than it needs to be. The Formula is built to be read the way you'd read a character sheet: glance at the stats, understand the build, decide fast whether it actually fits your strategy or not.
How three Core Scores turn filings into a stat block
The Stoxcraft Formula is the scoring engine behind every Stoxcraft card, turning raw financial data into three Core Scores plus a real-time layer on top. It exists so you can size up a company the way you'd size up a character sheet, not the way you'd wade through a stack of financial paperwork yourself.
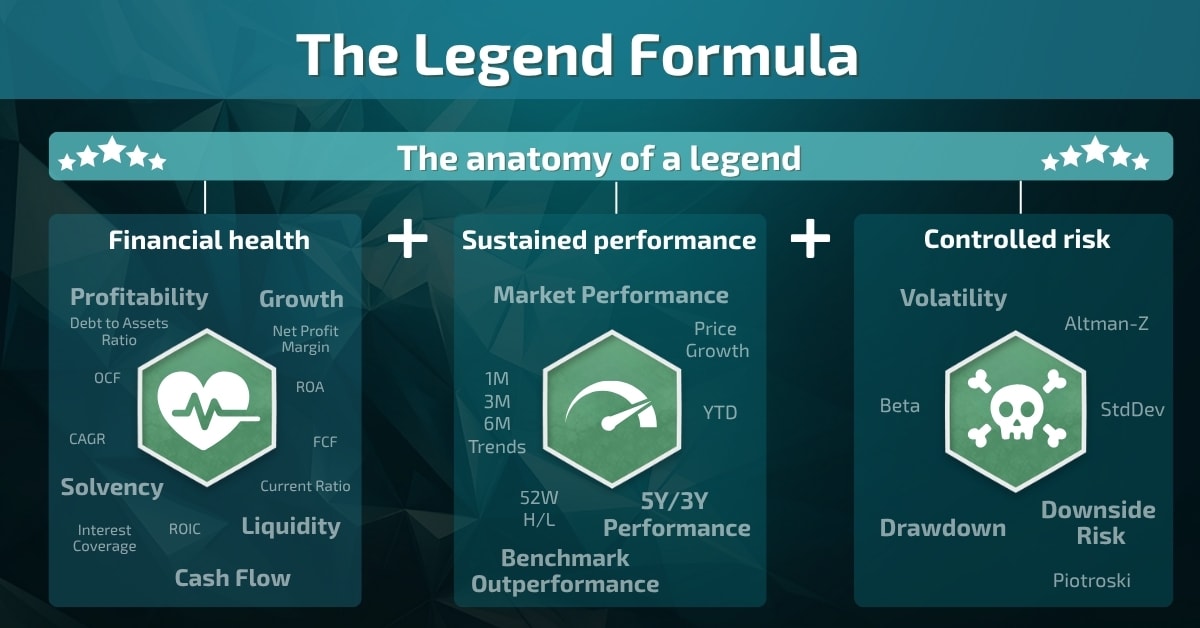
How the Stoxcraft Formula turns filings into stats
Every Health Score starts with the same unglamorous work: pulling apart a company's financial filings and checking things like how steady its cash flow really is and whether its margins hold up against sector peers. None of that reads any easier than the fine print on a phone contract. Compressed into one Health Score, benchmarked against the company's own sector, it reads in under five seconds.
That sector-relative part matters more than it sounds. A Health Score of 7 for a bank and a 7 for a software company come from completely different playing fields. The Formula benchmarks each company against its own peers first, so a high Health Score means you're not just keeping up, you're near the top of your own bracket.
It's also worth knowing that Health Score runs independently from Performance Score. A stock can be financially sound and still have gone nowhere on price for a year, or the reverse: a hot run of returns sitting on top of a shakier balance sheet. Reading Health and Performance as one blended number would hide exactly that gap. Reading them separately is what lets you see it.
Performance Score works differently. Instead of filings, it's built from actual price returns compared across different timeframes, short-term moves weighed against the longer, multi-year picture. A high Performance Score means a stock has held up well whether you zoom in on the last few months or zoom out to the last few years, not just caught one lucky quarter.
Why Risk Score reads backward from Health and Performance
Here's the one rule worth memorizing before anything else: a high Risk Score is not a good thing. Health and Performance both work the same direction, higher is better. Risk Score flips. A high Risk Score means more volatility, bigger drawdowns, a shakier balance sheet underneath. A low Risk Score means the opposite: a calmer ride. Neither direction is automatically the right call. It depends entirely on what you're actually trying to build.
The Formula builds Risk Score largely from how far a stock has fallen from its highs and how much it swings day to day. It won't tell you a stock is bad. Plenty of high-risk, high-reward setups are exactly what some portfolios need. It tells you what kind of volatility you're actually signing up for before you're already on the ride.
TrendMeter and BuyMeter: the layer that moves in real time
Health, Performance and Risk describe the fundamentals: the version of a company that doesn't change much week to week, closer to a character's base stats than anything reactive. TrendMeter and BuyMeter describe right now instead, the equivalent of a live status effect layered on top of those base stats. TrendMeter tracks momentum and recent price action to show whether a stock is gaining strength or losing it, labeled in plain language with a directional arrow instead of a raw number: Soaring, Climbing, Rising, Dipping, Falling, Crashing.
Every shift in that momentum, along with every change in sentiment and analyst outlook, gets logged over time instead of just silently overwritten with the newest reading. A stock sitting at "Rising" after three straight weeks of "Falling" tells a different story than one that's been "Rising" for months straight, even though both show the exact same label today. BuyMeter works the same way on the sentiment side, layering on analyst ratings and short-term indicators to show how the crowd is currently leaning, from Strong Buy to Strong Sell.
Stoxcraft doesn't hide behind clinical language here either. A stock clawing back from a beating shows up as "Respawned at 1 HP, still fragile, but back in play." One in freefall reads "Rock bottom, the fall's complete, stability nowhere to be found." Neither label needs a glossary to understand, and that's the whole point of writing it this way instead of burying the same information in a footnote. The full breakdown of how the card itself is put together lives in the secret behind Stoxcards, if you want the layout explained alongside the scores.
Compare two builds side by side

Two stocks can look similar on a spec sheet and still play nothing alike once you're actually holding them through a fairly rough week for the broader market as a whole. That's exactly where reading all three Core Scores together earns its keep instead of fixating on just one number, and it's easiest to see with two companies most people already recognize on sight.
Put two real companies next to each other and the system clicks fast. Apple carries a high Health Score, reflecting strong, steady cash generation and margins that have held up for years. Its Performance Score stays solid whether you look at the short-term or the multi-year picture. Its Risk Score sits low. Calm, predictable, built for the long game.
Coinbase can carry a similar Health Score on paper and still feel like an entirely different stock. Pair that health with a choppier Performance Score and a much higher Risk Score, and the picture changes completely: faster moves, sharper reactions, a business that leans hard on market sentiment. Same three scores. Completely different builds. That's the whole point of reading scores instead of raw numbers. You're not just seeing two companies. You're seeing two different playstyles, and behavioral research on how investors anchor on single metrics suggests that reading the full picture, not one favorite number, is exactly what keeps that decision honest.
What the Stoxcraft Overall Rating actually rewards
All three Core Scores roll up into a single Overall Rating, shown only as stars, never as a raw number underneath. Five stars is not handed out for being good at one thing. A stock earns it by being financially healthy, consistently outperforming, and staying within a reasonable risk band, all at once.
That combination is rarer than any single strong score. A stock can post an excellent Performance Score alone and still land at three stars if the balance sheet or risk profile drags the average down. The Overall Rating is the Formula's way of asking one blunt question: not just whether a stock is doing well right now, but whether it's actually a well-built stock. Five stars is the closest thing on the platform to pulling a legendary card, rare enough that it should actually mean something when it happens. Pull up any card on the Stoxcraft Screener and the same logic applies, whichever ticker you start with.
The picture isn't frozen the day you look at it either. New filings shift the Health Score. A rough quarter or a sharp rally moves Performance. A volatile week nudges Risk. The Overall Rating recalculates as the inputs change, so a stock you checked last month is still worth a second look, not just a memory sitting in the back of your mind, and treating an old rating as permanent is one of the more common mistakes investors make here, right up there with ignoring the trend entirely. The rest of the Stoxcraft Academy builds on this same Formula in every skill that comes after it.
Read your first card like a Stoxcraft pro
Ready to actually read a card instead of guessing at it? Pull up any stock on Stoxcraft and work through it in this order. It takes less time than reading the terms and conditions on a new app, and it works the same way on every single card on the platform.
1. Check Health Score first. Look at how it compares to sector peers, not the raw number alone. A 6 in banking and a 6 in software mean very different things, so context always comes before the number itself.
2. Read Risk Score as a warning label, not a bonus. A high number means more volatility, not a better stock. Decide if that ride actually fits what you're building before you get excited about the upside.
3. Let the Overall Rating be the tiebreaker. If Health and Performance both look solid but the star count feels low, Risk Score is probably why. Go check it before you assume the rating is wrong.
Do this three or four times across different sectors and the scores stop feeling like abstract numbers. They start feeling like a language you already speak, the same way stats on a character sheet stop feeling foreign after a few hours in the game.
Ready to see how well this stuck? Test what you just learned.
Skill Check
Test what you just learned
A couple of quick questions to lock in what you covered here, then straight on to the next skill.
1 of 3
questions
How do Stoxcards help users understand data more easily?